
Ukraine War Upd. EXTRA: General Staff Russian Losses Data Analysis
Table of Contents 📖
| Topic ID | Topic Title | Timestamp |
|---|
"Even if you don't agree with the exact figures on a daily basis, it tells you generally what's happening at the very least."
Introduction
Hello Team! In this extra video, Jonathan analyses the data on Russian losses provided by one of his channel contributors, Dell. The data comes from the Ukrainian General Staff and is freely available for anyone to view. Jonathan uses this data to identify trends and draw insights into what is happening in the war, even if the exact daily figures may not always be precise.
Return to top⤴️
Personnel Losses
The steepness of the line on the graph indicates the rate of Russian personnel losses. The graph shows upticks in losses during the Bakhmut offensive and the Ukrainian counter-offensives in Kharkiv and Kherson in September-November 2022. More recently, there has been a slight downtick as Ukraine has stepped back from close engagement and shifted to targeting Russian forces with HIMARs and artillery. However, the Russians are still losing a significant number of troops, over 500 per day.
Return to top⤴️
Tank Losses
The graph shows a significant uptick in Russian tank losses during the Kharkiv and Kherson counter-offensives, though not as high as the losses at the beginning of the war around Kyiv. However, tank losses have decreased more recently. Jonathan believes this is because Russia has lost so many tanks that they are now using them more cautiously and simply have fewer of them available. The trend line on the graph supports this view.
Return to top⤴️
Armoured Vehicle Losses
The data shows high losses of Russian APCs, IFVs and other armoured vehicles at the start of the war and during the Ukrainian counter-offensives. There was an uptick at the beginning of the current counter-offensive, but this has decreased as Ukraine has shifted to engaging Russian forces at a distance with HIMARs and artillery rather than close combat.
Return to top⤴️
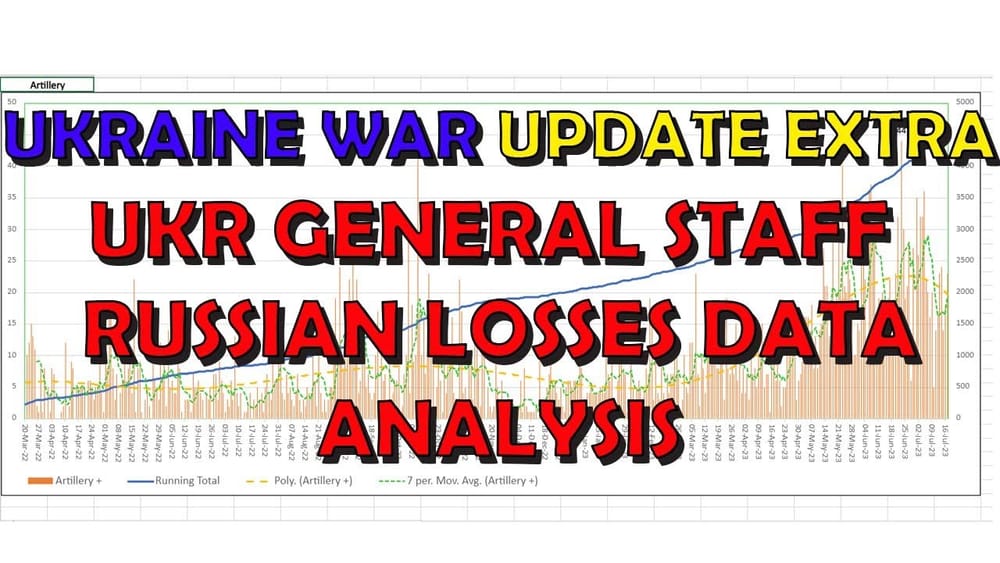
Artillery Losses
In contrast to the other categories, the artillery data shows a significant increase in Russian losses over the past 2-3 months. However, there has been a slight downtick in the last week, which Jonathan attributes to Russia having lost so much artillery that they now have less available at the front lines. He suggests this could indicate a coming change in Ukraine's approach as they may soon shift from targeting artillery to a ground offensive push.
Return to top⤴️
MLRS Losses
The trend line for Russian MLRS losses has been fairly consistent over the last year but is now ticking upwards. The Russians are sometimes losing 4-5 MLRS per day, with their worst day seeing 10 lost, which is a significant number.
Return to top⤴️
Air Defence Losses
The graph shows an increasing trend in Russian air defence system losses. Jonathan notes that this will be a major priority for Ukraine as they seek to enable their own close air support operations and counter Russian air attacks in the upcoming counter-offensive.
Return to top⤴️
Aircraft Losses
After suffering steep losses at the beginning of the war, Russia has become much more cautious with its use of fixed-wing aircraft. They are now tending to use standoff weapons like FAB-500 bombs from outside the range of Ukrainian air defences. Helicopter losses have also decreased and Jonathan notes there has been less footage recently of Russian helicopters attacking Ukrainian positions, suggesting a more cautious approach.
Return to top⤴️
Drone and Missile Losses
The data shows a significant increase in Russian Shahed drone losses, with 20-30 being lost on some nights. However, cruise missile use has been minimal in the last couple of weeks, with no large saturation attacks. Jonathan believes this indicates that Russian missile stocks are very limited.
Return to top⤴️
Vehicle and Fuel Tank Losses
Although not as dramatic as some other categories, the data shows a consistent loss of Russian vehicles, particularly logistical trucks and fuel tanks. This aligns with the artillery and air defence data in showing a degradation of Russia's ability to supply its front line forces.
Return to top⤴️
Wrap Up
Jonathan encourages viewers to explore the data for themselves via the link in his video descriptions. He expresses his appreciation to Dell for compiling it. Thank you for watching this analysis and take care!
Return to top⤴️